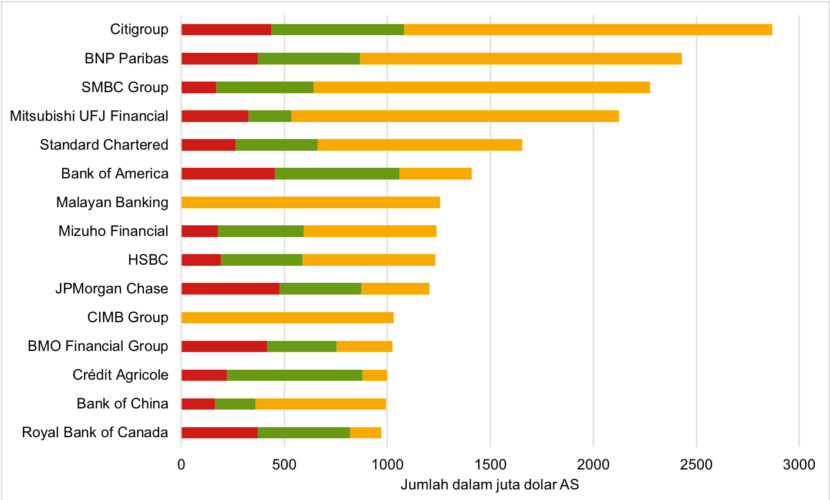
Top 5 Forest-Risk Clients

Credit & underwriting (2016-2024)

  • Johor Group
    1228.92 (USD Million)
  • Sinar Mas Group
    975.93 (USD Million)
  • Felda Group
    406.13 (USD Million)
  • Top Glove
    391.92 (USD Million)
  • Batu Kawan Group
    368.21 (USD Million)

5 investasi teratas

Share & bond holdings (latest, 2024)

  • Genting Group
    1.28 (USD Million)

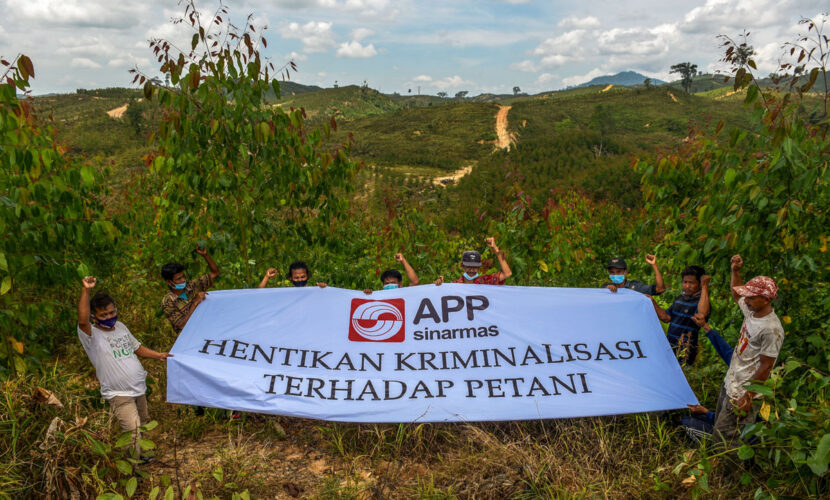
Note: Red flags are give to companies for which big social and environmental impacts have been documented

penilaian kebijakan


Weighted Total Score
0 4.9 10
4.9
Environment Total Score
0 5.7 10
5.7
Social Total Score
0 4.6 10
4.6
Governance Total Score
0 4.3 10
4.3

Scores by Sector


kategori Daging sapi Kedelai minyak sawit Bubur kertas dan kertas Kayu Karet Weighted Total The total scores are calculated based on the weighted average of the sector scores, according to the exposure of the financial institution to each sector.
Environment 2.2 2.2 5.8 4.9 4.9 4.7 5.7
Social 0.5 0.5 4.7 3.8 3.8 2.5 4.6
Governance 2.4 2.4 4.4 3.9 3.9 3.1 4.3
Total 1.8 1.8 4.9 4.2 4.2 3.4 4.9

detail penilaian


kriteria kategori Daging sapi Kedelai minyak sawit Bubur kertas dan kertas Kayu Karet Weighted Total The total scores are calculated based on the weighted average of the sector scores, according to the exposure of the financial institution to each sector.
1. Companies and their suppliers must commit to zero-deforestation and no-conversion of natural forests and ecosystems. Environment 0 0 7 7 7 7 7
2. Companies and their suppliers must not drain or degrade wetlands and peatlands. Environment 0 0 7 7 7 7 7
3. Companies and their suppliers must not convert or degrade High Carbon Stock (HCS) tropical forest areas. Environment 0 0 7 7 7 7 7
4. Companies and their suppliers must not operate in, or have negative impacts on, protected areas. Environment 5 5 5 5 5 5 5
5. Companies and their suppliers must identify and protect High Conservation Value (HCV) areas under their management. Environment 5 5 7 7 7 7 7

More ways to discover connections

  • Compare Banks

    Assess how two, three, four, or more banks stack up against one another by examining their financial holdings for specific sectors in select regions.

    Start Comparing
  • Explore Data

    Not sure where to start? Start here. The quick view tool allows you to interact with a small, but powerful set of data to create a visualization organized by region, sector, or finance type.

    Start Exploring
  • Search Database

    Dig deeper into our database of financial connections between banks, investors, and deforestation-risk companies, with up to 10 search criteria options.

    Start Searching